 Photo ©
CLO Macaulay Library
A Graphical Representation of Bird Sounds
by Colleen McLinn
Learning Goals:
Students will understand some common ways in which sound is represented
visually, and gain practice in comparing visual and auditory representations of
sounds.
Learning Objectives:
- Students will be able to correctly draw or predict changes in sound frequency,duration, and amplitude using a spectrogram representation of sound.
- Students will be able to identify the sounds or mnemonics of a few common urban bird species.
Materials Needed:
- Cards with emotions or ideas listed on them
- Index cards with lines or grids
- Transparent tape
- Slide explaining how to read a spectrogram (see below)
- A computer
- Five to ten bird sounds to play (from the CUBs species list)
- Spectrograms for two to three sounds (download a handout here)
Background:

farther away. We can’t see sound directly, but researchers have developed ways to graph its properties or characteristics in order to study it.

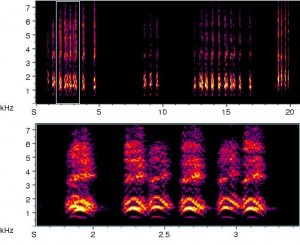
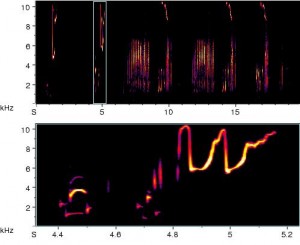
There is another way to plot sounds, often used by researchers who study bird song. It is called a spectrogram (or sonogram). Although you may not have seen one of these before, when you get used to looking at them, it makes it much easier to see changes in frequency over time.
Musical Notation vs. Spectrogram notation:
- Spectrograms are similar because: Time is on the x-axis as in musical notation, and frequency or pitch of the sounds is on the y-axis. Like chords in music, there may be more than one frequency at a given time (and there may be harmonics).
- Spectrograms are different because: Instead of notes, bird songs are displayed as continuous lines based on their frequency at a given time.
- Spectrograms give you even more exact information than musical notation by telling you exactly how long a bird holds each note, down to the millisecond.
- Another way a spectrogram is slightly different than musical notation is that it gives you information about how loud a sound is. (Musical notation has time signatures or words that indicate speed but isn’t set up for fine scale directions about loudness, they just have verbal guidelines like pianissimo!)
Procedures (download full sample slideshow for this activity here):
1. Communicating Without Words
a. Have students pair up and give each a stack of cards with an idea or emotion written on them. Have the students sit with their backs to each other and take turns attempting to convey the message on the card using only a single syllable (ba, da, etc.)
b. Their partner will attempt to guess the message being conveyed and must explain their reasoning.
c. Students should go through all the cards and write down their guesses and reasoning on individual worksheets before comparing to what was written on the cards.
d. Debrief as a group. What were some ways that you varied your voice in order to convey a message? Do you think animals do something similar in order to convey a message?
e. Optional: Play a few examples of animal sounds (use ones that the instructor knows the underlying message/meaning of). Ask the students what they think each one is trying to express.
f. Next, we are going to get a bit more specific about what we mean by how sounds vary.
2. Seeing Sounds
a. Give each student a blank index card. Tell them you are going to play a sound and their task is to draw a picture that represents how the sound might look. Play the sound several times.
b. Ask for volunteers to show their drawings. There are no right or wrong answers at this stage! You might want to tape some of these to a board to show the variety of different notations people used.
c. Make the point that if you need to interpret and quantify sounds so that other people can read them, you need to come up with a common language to communicate in or common conventions to use.
d. Ask the students if they have ever seen another representation of sound.
e. One familiar example is musical notation. Ask the students to help you draw an example of musical notation. What is the horizontal axis? What is the vertical axis? Did anyone draw anything like musical notation on their index cards?

f. Introduce the term “spectrogram” (optional: show an example of the spectrogram for the sound you just played). Tell the students that a spectrogram is a scientific way of looking at sound that has some similarities to musical notation.
g. Show some examples of how sound (pitch) frequency, loudness (amplitude), or duration is represented on a spectrogram. You might show the images and ask the students to guess what they sound like, or model/play the sounds in the spectrograms.
h. Ask or tell the students how a spectrogram is similar to musical notation. How is it different?
3. Celebrate Urban Birds Sounds
a. Ask the students if they think seeing sounds as you hear them can really help you understand and remember specific bird sounds.
b. Make sure each students has 5-10 index cards and a pen ready. Tell them, “For each sound I play, write the name of the species on the back. Draw your best estimate of what the sound spectrogram might look like on the front.” (Leaving up the slide about spectrogram notation will probably make this easier).
c. Play 5-10 example sounds of Celebrate Urban Birds Species, giving the students the name of the bird first each time. Play the sounds several times if needed. Do NOT show the spectrograms for these sounds—the students should be just listening at this stage.
d. Have the students pair off. Shuffle the cards and have one person hold up a card to show their partner. Do not show or tell them the species name written on the back.
e. The partner’s job is to guess what species the card corresponds to by finding their own similar drawing. Have the students continue the matching game (taking turns to hold up a card), until all cards have been matched. If you want, you can tally how many each of you got right on your first, second, third, guesses.
f. Debrief about the activity as a class. Ask the students, “How did you interpret that sound compared to how your partner interpreted it? How similar or different are the drawings?”
Assessment Ideas:
Have the students make drawings representing duration, frequency and amplitude. (“Draw a sound that has a duration of X seconds and increases in frequency”).
Extension Ideas:
Using the index cards you made:
- Sort by similarity and defend your reasoning.
- Vote who is closest to the “real” spectrogram. This could lead into a higher-level physics lesson on how spectrograms are calculated from a waveform (Fourier Transforms).
- Select two student examples for each species (should work for a class size up to 32). Distribute one to each student. Their job is to imitate is as well as they can based on the drawing, and attempt to find their partner in the noisy crowd.Sort by calls vs. songs and look for patterns. The spectrograms on All About Birds and the CUBS bird guide describe whether the recording is a call or song.
- This could be used to start a lesson about the difference between a call and a song. (Note that the different is not just based on form but on the function for which a call or song is used.)
- Sort by habitat the bird lives in (which you can find on the online bird guides) and look for patterns. This could lead into a lesson about sound propagation through the environment and how different wavelengths will either bend around objects like trees or bounce off of them.
- Sort the cards by oscines and suboscines (“true” songbirds and other species). This will require some extra research about what suborder the each species is in. This could lead into a lesson on how birds make sound or how to read a cladogram or evolutionary tree. After sorting the recordings by similarity, see how these groupings map onto other traits like habitat, sound type, and suborder. You could do this in a tactile/visual way using color and symbol codes on the index cards, or make it a technology lesson by entering the states for each character into a spreadsheet or cladogram program.
Adaptations for Visual- or Hearing-Impaired Individuals:
- Emphasize mnemonics that go with bird sounds.
- Learn the individual syllables better by slowing down the songs in Raven.
- Make a sound map of the schoolyard.
- Emphasize visual analysis with color spectrograms, discussing frequency and amplitude modulation.
- Compare a spectrogram to a waveform or oscilloscope representation of sound.
Useful Websites:
Macaulay Library Sounds and Videos
Raven Sound Software (download free Raven Lite program)
Acknowledgments:
Part 1, Communicating Without Words, was developed in cooperation between the Cornell Lab of Ornithology and Wayne-Finger Lakes BOCES for a middle school unit on Birds and Physics (NSF DUE-0532786). Many thanks to Amy Monachino, Daena Ford, Sharon Bassage, Mya Thompson, and Karen Purcell for ideas and improvements!